Usage
Command-line applications
Adapter trimming
The trim_adapters utility is based on a script by Jason Buenrostro (see the original ATAC-seq paper: Buenrostro, Jason D; Giresi, Paul G; Zaba, Lisa C; Chang, Howard Y; Greenleaf, William J. 2013. Transposition of native chromatin for fast and sensitive epigenomic profiling of open chromatin, DNA-binding proteins and nucleosome position. Nat Meth 10, 1213–1218.)
Instead of looking for known adapter sequence, it aligns paired reads to each other and trims off sequence outside the alignment. More precisely, it searches the forward read for the reverse complement of a specified number of bases (20 by default) at the beginning of the reverse read, then falls back to finding the best alignment of the two reads, using the minimum Levenshtein distance between them.
Changes from the original script:
- The
--max-edit-distanceoption to specify the maximum edit distance when aligning the reads. - The
--fudgeoption to not trim a base from the result to satisfy bowtie – other aligners like bwa don’t have the apparent problem with exactly overlapping reads. The default is 1 for compatibility with the original script. - The
--rc-lengthoption to specify the amount of the reverse read to reverse complement and search for in the forward read. - The
--trim-from-startoption to remove extra bases from the beginning of each read. We found this necessary with OH-seq. - Output is gzipped.
Cut matrix generation
The make_cut_matrix script can be used to generate two types of
matrices by counting the ATAC-seq cut points (transposition sites)
around known motifs, given a BAM file of aligned reads from an
ATAC-seq experiment and a BED file of motifs.
Discrete matrices
The first type of output, which we call discrete, is intended to produce input for CENTIPEDE. The output matrix contains a row for each motif, representing the cut point counts at positions within and around the motif for each fragment size bin. For each fragment size bin and resolution you specify, the cut points at each position in the motif and an extended region you specify are counted, and every resolution positions in the extended area on either side of the motif are summed. So each row will contain for each fragment size bin a sequence of (possibly aggregated) scores in the region upstream of the motif, a sequence of scores for each position in the motif, and a sequence of (possibly aggregated) scores in the region downstream of the motif.
An example invocation:
make_cut_matrix -d -b '(36-149 150-324 325-400 1)' -p 8 \
  input.bam \
  JASPAR2014_CTCF.bed.gz | \
  gzip -c > CTCF.discrete.matrix.gz
That would count any reads with lengths between 36-149, 150-324, and
325-400 from input.bam whose cut points fell in the specified
region around motifs from JASPAR2014_CTCF.bed.gz. The cut point
counts would be recorded for each fragment size bin, at nucleotide
resolution (with no score aggregation in the extended region around
each motif). Since the length of the extended region was not
specified, it would use the default. The program would use eight
concurrent scoring processes, and the output would wind up in
CTCF.discrete.matrix.gz.
Aggregate matrices
After you’ve run CENTIPEDE with the resulting discrete matrix, and identified bound and unbound motifs (perhaps using posterior probabilities of at least 0.95 or at most 0.5, respectively), you can move on to generating what we call aggregate matrices. These are designed for creating a plot of the ATAC-seq signal around a single motif.
An aggregate matrix contains a row for each combination of position, fragment size bin, and strand within and around the motif, with columns representing the absolute and mean cut point counts at each position.
An example invocation, using a BED file of bound motifs:
make_cut_matrix -a -b '(36-149 150-324 325-400 1)' -p 8 \
  input.bam \
  CTCF_bound.bed.gz | \
  gzip -c > CTCF_bound.aggregate.matrix.gz
Do the same for your unbound motifs, and you’re ready to plot.
Binning
For either matrix, we count cut points in groups of bins according to the length of the reads’ fragments, with optional reduction of scores in regions around motifs to a resolution you specify for each group. This is regrettably complex to explain, so I will resort to crude pictures.
Assume you want to count cut points from fragments with lengths in the following ranges at different resolutions:
| Fragment bin group | Resolution |
|---|---|
| 36-149 | 1 |
| 150-224 and 225-324 | 2 |
| 325-400 | 5 |
The command line specification for this scenario would look like this:
make_cut_matrix -a -b '(36-149 1) (150-224 225-324 2) (325-400 5)' ...
Pretend you’re scoring a motif 5 bases long, with a 10-base extended region on either side, and for simplicity, pretend that each template length bin had the same counts of cut points around the motif, shown here:
extended region     motif     extended region
------------------- --------- -------------------
0 1 2 3 3 4 4 4 4 5 9 2 0 2 7 5 4 4 4 4 3 3 2 1 0
The matrix would contain scores for each position in the first bin
group, (36-149 1):
extended region     motif     extended region
------------------- --------- -------------------
0 1 2 3 3 4 4 4 4 5 9 2 0 2 7 5 4 4 4 4 3 3 2 1 0
The second bin group, (150-224 225-324 2) would contain sums of
every two scores in the extended region, plus every score in the motif
itself:
extended region                 motif     extended region
------------------------------- --------- ------------------------------
(0+1) (2+3) (3+4) (4+4) (4 + 5) 9 2 0 2 7 (5+4) (4+4) (4+3) (3+2) (1+ 0)
resulting in:
e.r.      motif     e.r.
--------- --------- ---------
1 5 7 8 9 9 2 0 2 7 9 8 7 5 1
Furthermore, since this group contains two bins, what ultimately goes into the output matrix would be the entrywise sum of each bin’s scores.
The scores for the last bin group, (325-400 5), after adding every
five scores in the extended region:
e.r. motif     e.r.
---- --------- ----
9 21 9 2 0 2 7 21 9
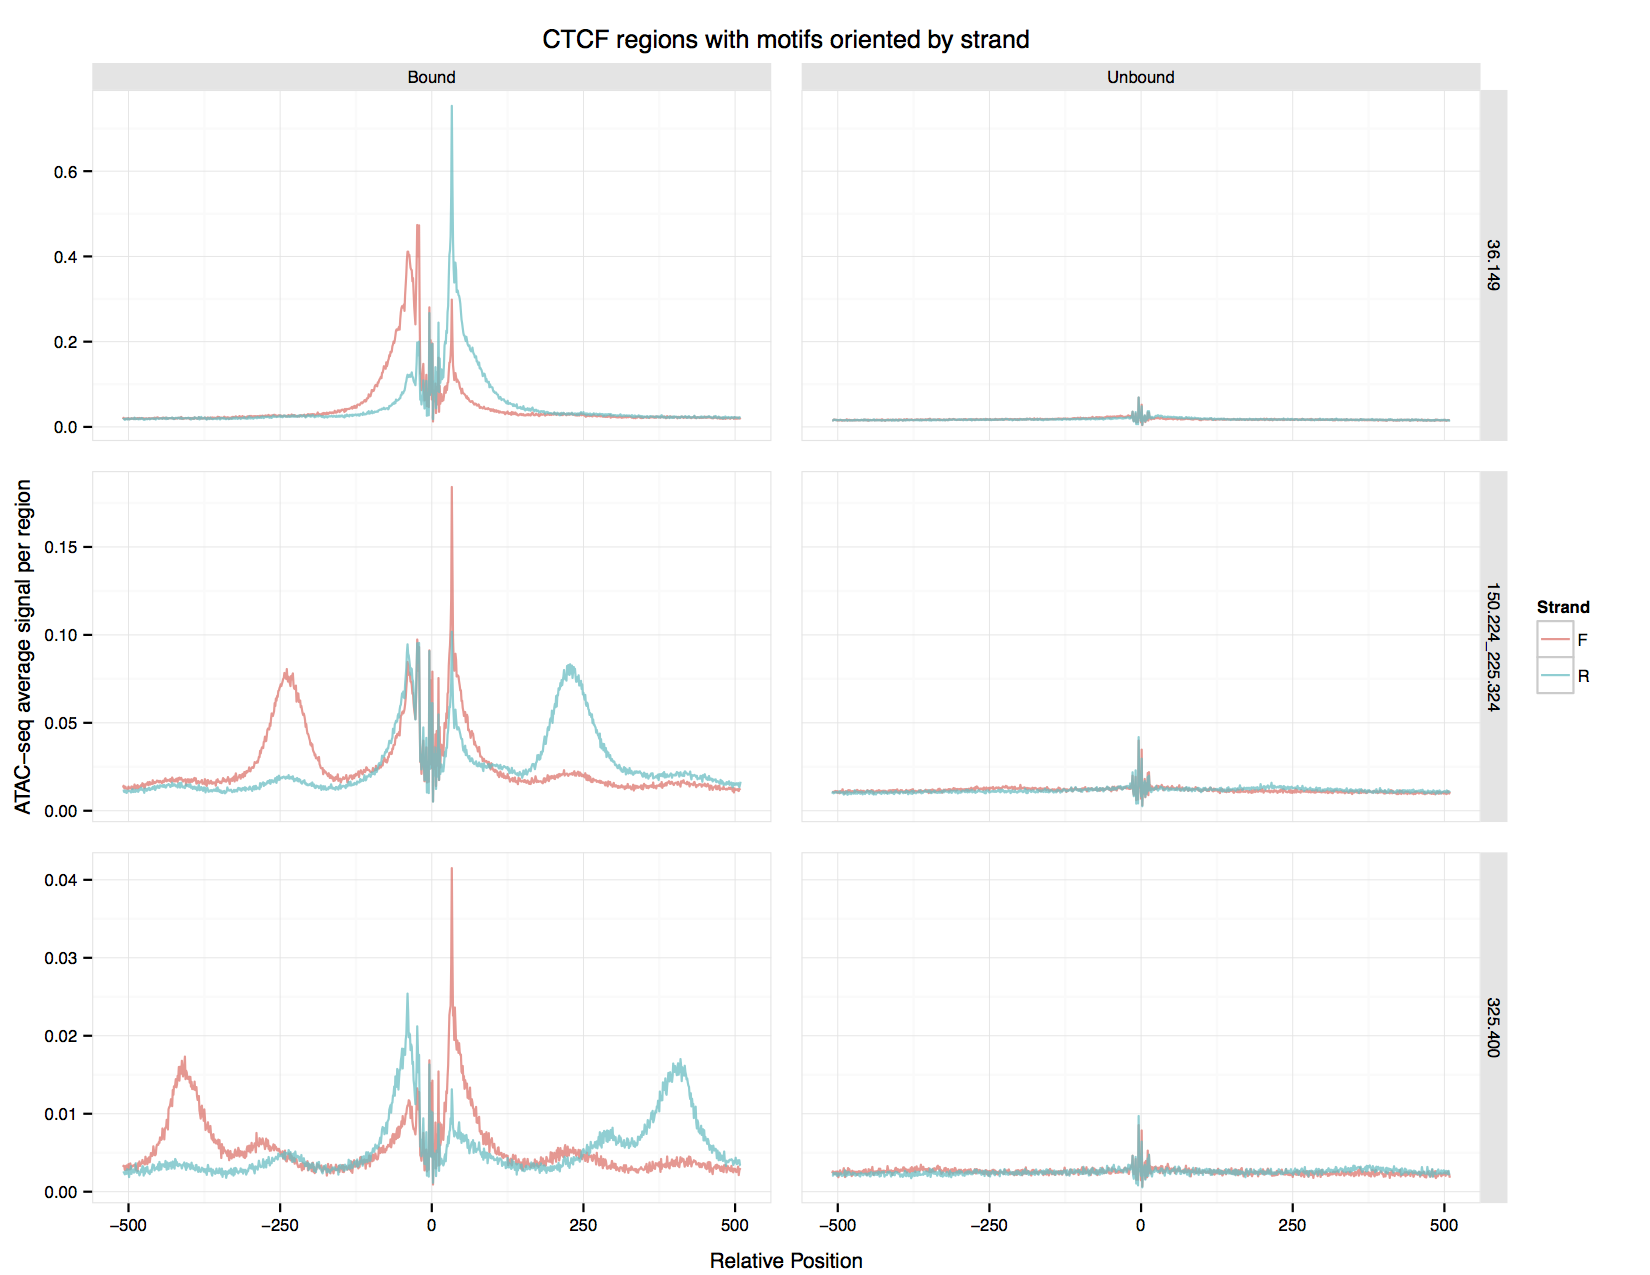
Creating ATAC-seq signal plots for motifs
The output of make_cut_matrix --aggregate-output can be plotted
with plot_aggregate_matrix.R. Pass it the aggregate output for a
bound motif, the aggregate output for an unbound motif, a title for
the plot and the name of the PDF file in which to save the plot.
An example of the output produced by:
plot_aggregate_matrix.R CTCF_bound.aggregate.matrix CTCF_unbound.aggregate.matrix "CTCF regions with motifs oriented by strand" CTCF.pdf
Using the atactk library
There are several modules in the atactk package that you might
find useful in processing ATAC-seq data, particularly atactk.data
and atactk.metrics.
The atactk.data module simplifies reading and manipulating
features from BED files. It handles gzipped or uncompressed files
automatically, and makes it simple to filter aligned segments from a
BAM file using standard SAM flags. It also makes it easy to read two
FASTQ files simultaneously, producing a sequence of paired reads.
The atactk.metrics module makes it easy to measure ATAC-seq cut
points around a feature.
There are also the atactk.command and atactk.util modules,
which support parsing of our interval specifications and provide some
generic functional tools used in the other modules.
We’ve made an effort to ensure the library is completely documented (see the Module Index). If you find the documentation incomplete or unclear, please file a bug report.